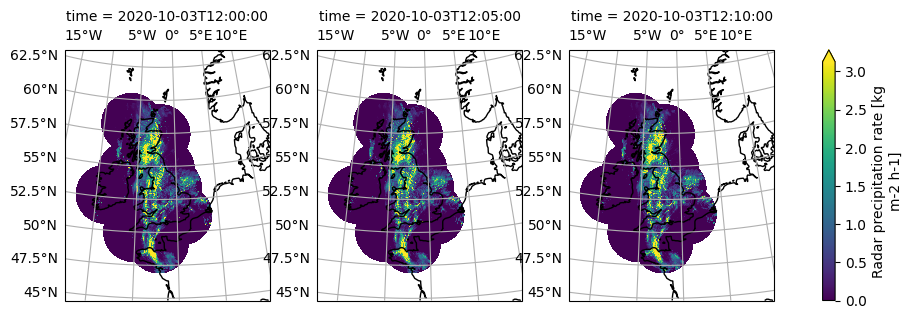
This notebook describes how to access and use the zarr-version of the UK Met Office C-band rain radar 1 km composite dataset. The dataset provides 5-minute precipitation rates in mm/h at 1 km × 1 km spatial resolution over the United Kingdom, derived from the Met Office radar network. The data uses the OSGB 1936 / British National Grid projection (EPSG:27700). The v0.1.0 zarr version of the dataset covers July 2005 to the end of 2025.
The raw NIMROD data was downloaded from CEDA and converted using mlcast
import matplotlib.pyplot as plt
import cartopy.crs as ccrs

import mlcast_datasets
cat = mlcast_datasets.open_catalog()
list(cat.precipitation)['radklim_hourly',
'radklim_5_minutes',
'dmi_10_minutes',
'it_dpc_sri_5min',
'uk_metoffice_5min',
'be_rmi_radclim_mfb_5min']
UK Met Office 5-min radar precipitation
The UK Met Office radar dataset is available in the intake catalog as uk_metoffice_5min.
ds = cat.precipitation.uk_metoffice_5min.to_dask()
ds
Loading...
var_name = "RR"

crs_name = ds[var_name].grid_mapping
data_crs = ccrs.Projection(ds[crs_name].crs_wkt)

g = (
    ds[var_name]
    .sel(time="2020-10-03T12")
    .isel(time=slice(None, 3))
    .plot(
        transform=data_crs,
        cmap="viridis",
        add_colorbar=True,
        col="time",
        robust=True,
        subplot_kws=dict(projection=data_crs),
        vmin=0,
    )
)

for ax in g.axs.flat:
    ax.coastlines()
    ax.gridlines(draw_labels=["top", "left"])
/home/runner/work/mlcast-datasets/mlcast-datasets/.venv/lib/python3.12/site-packages/cartopy/io/__init__.py:242: DownloadWarning: Downloading: https://naturalearth.s3.amazonaws.com/50m_physical/ne_50m_coastline.zip
warnings.warn(f'Downloading: {url}', DownloadWarning)