This page covers the mlcast-datasets intake catalog — the source data layer of the MLCast project — and the sampler used to turn source data into training-ready indices.
Data flow
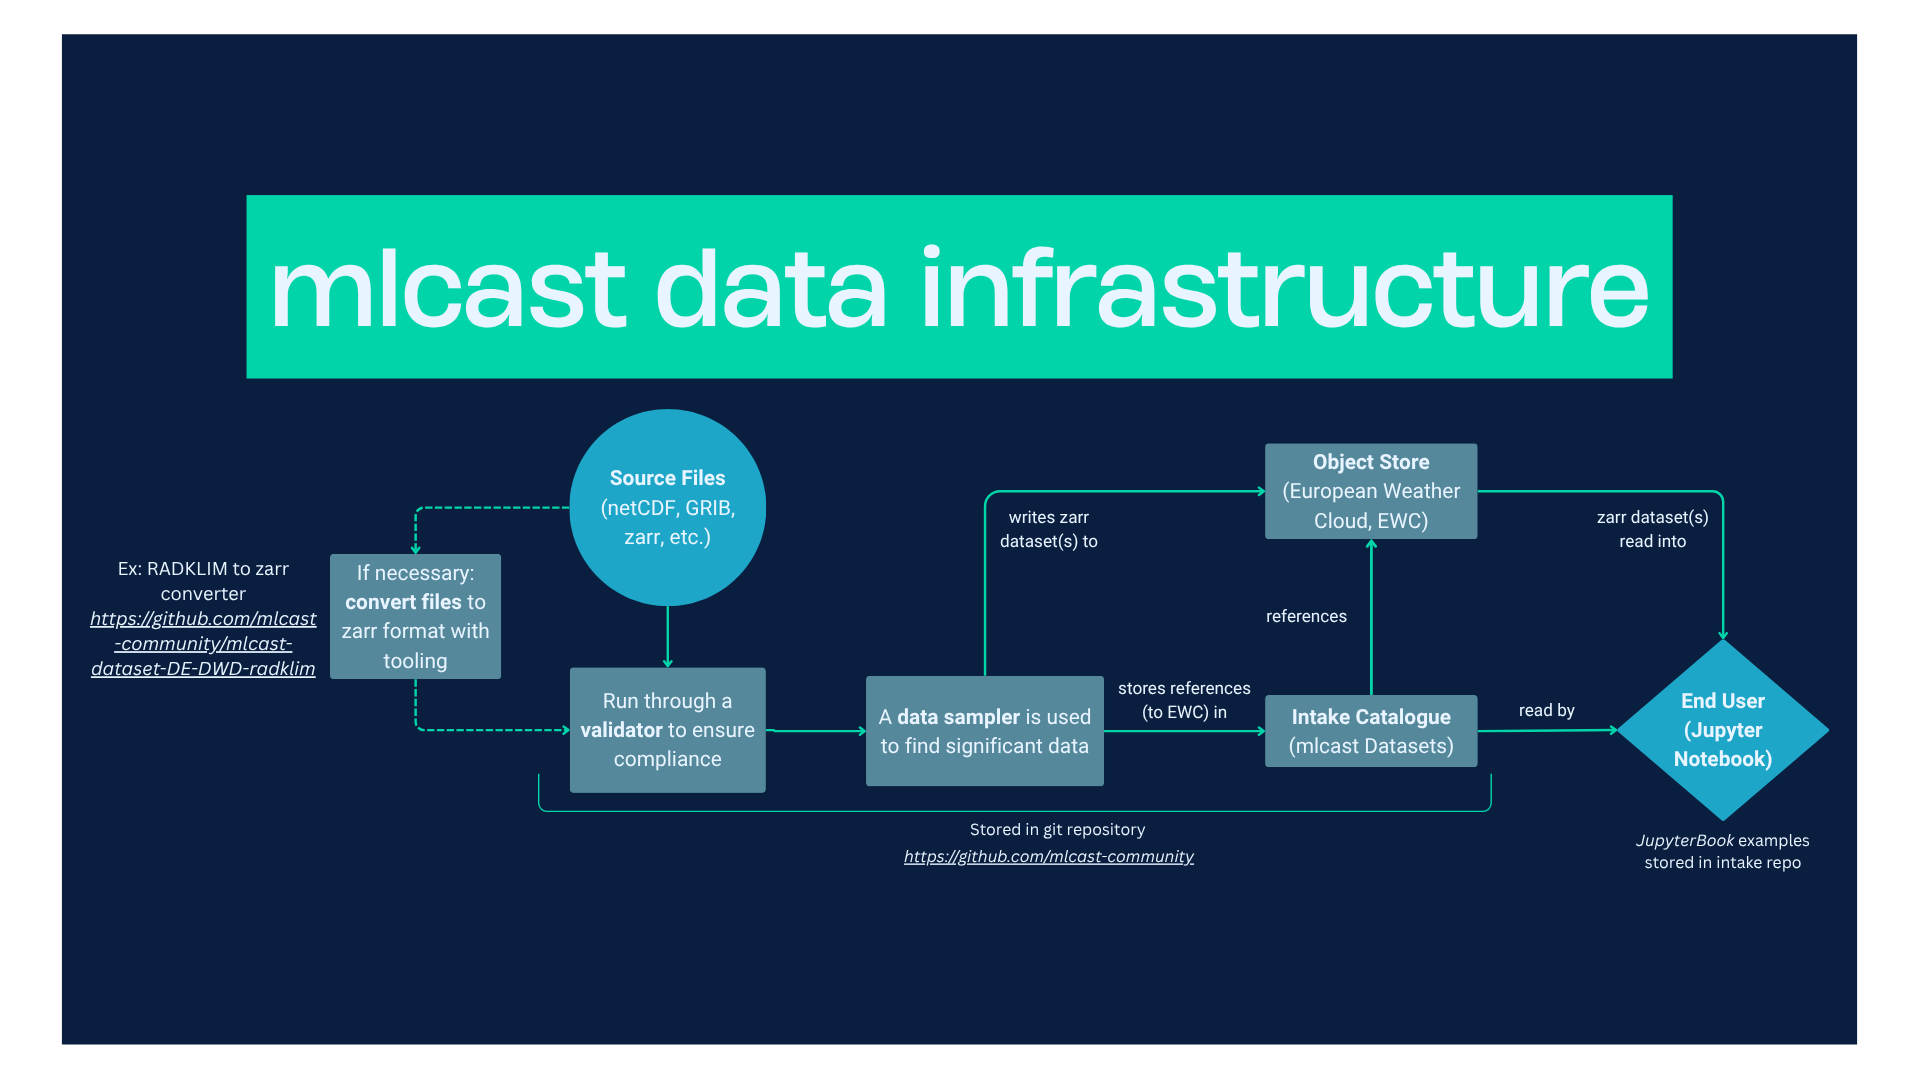
The diagram below (from the mlcast-datasets README) shows the intended data flow and how the intake catalog fits into the overall architecture of the MLCast project.
The intake catalog
The catalog is a curated collection of open-source weather radar datasets, made available so you can build machine-learning training datasets from them.
Reading the catalog directly from GitHub
Use this for the most recent version of the catalog. Install the required packages:
pip install intake intake-xarray zarr jinja2
# or pull everything via the package:
pip install git+https://github.com/mlcast-community/mlcast-datasets
Then open the catalog from Python:
import intake
cat = intake.open_catalog(
    "https://raw.githubusercontent.com/mlcast-community/mlcast-datasets/main/src/mlcast_datasets/catalog/catalog.yml"
)
Installing the mlcast_datasets package
Use this for a stable, tagged version of the catalog:
pip install mlcast-datasetsimport mlcast_datasets
cat = mlcast_datasets.open_catalog()Using data within the catalog
List the available sources, then load a dask-backed
xarray.Dataset with all variables and attributes:
>>> list(cat)
['precipitation']

>>> list(cat.precipitation)
['radklim_hourly', 'radklim_5_minutes']

>>> ds = cat.precipitation.radklim_5_minutes.to_dask()
>>> ds
<xarray.Dataset> Size: 10TB
Dimensions:          (time: 2419200, y: 1100, x: 900)
Coordinates:
  * time             (time) datetime64[ns] ...
  * y                (y) float64 ...
  * x                (x) float64 ...
    lat              (y, x) float64 dask.array<...>
    lon              (y, x) float64 dask.array<...>
Data variables:
    rainfall_amount  (time, y, x) float32 dask.array<...>
    crs              float64 ...
Attributes:
    mlcast_dataset_identifier:         DE-DWD-radar_precipitation-RADKLIM
    mlcast_dataset_identifier_format:  {country_code}-{entity}-{physical_var...}
    mlcast_dataset_version:            0.1.1
    ...
Available datasets
The catalog currently exposes five open-source weather-radar precipitation datasets covering different European regions. Each is documented in the mlcast-datasets intake catalog, maintained by the MLCast Community WG6 of the EUMETNET E-AI Optional Programme.
| Dataset | Region | Variable | Temporal res. | Spatial res. | Coverage | Size | License |
|---|---|---|---|---|---|---|---|
| RadKlim | Germany | rainfall amount | 5 min / hourly | 1100 × 900 (1 km) | 2001–2023 | ~10 TB | CC-BY-4.0 |
| DMI | Denmark | reflectivity (dBZ) | 10 min | 1728 × 1984 | 2016–2025 | ~14 TB | CC-BY-4.0 |
| IT-DPC | Italy | rainfall rate | 5 min | 1200 × 1400 (1 km) | 2010–2025 | ~7 TB | CC-BY-SA-4.0 |
| UK Met Office | United Kingdom | rainfall rate | 5 min | 1725 × 2175 (1 km) | 2005–2025 | ~31 TB | OGL-UK-3.0 |
| BE RMI RADCLIM | Belgium | rain rate (mm/h) | 5 min | 700 × 700 (1 km) | 2017–2023 | — | CC-BY-4.0 |
RadKlim — precipitation over Germany
Radar-based precipitation derived from the Deutscher Wetterdienst (DWD) radar network. Two sources are published:
precipitation.radklim_5_minutes—rainfall_amount(kg m⁻²), 5-minute steps, 2001-01-01 → 2023-12-31T23:55, 2,419,200 × 1100 × 900precipitation.radklim_hourly—rainfall_amount(kg m⁻²), hourly (reported at HH:50), 2001-01-01T00:50 → 2023-12-31T23:50, 201,600 × 1100 × 900
Grid in Polar Stereographic (variant B), standard parallel 60°, origin 10°;
x ∈ [-443, 456] km, y ∈ [-4758, -3659] km. Authors: Harald Rybka, Katharina
Lengfeld. DOIs 10.5676/DWD/RADKLIM_YW_V2017.002 (5-min),
10.5676/DWD/RADKLIM_RW_V2017.002 (hourly). Converter:
mlcast
DMI — radar reflectivity over Denmark
Ten-minute reflectivity composite from five DMI-operated radars. Variable
dbz (dBZ), 10-minute steps, 2016-02-29 → 2025-12-31, grid 1728 × 1984.
Stereographic projection (+proj=stere +ellps=WGS84 +lat_0=56 +lon_0=10.5666 +lat_ts=56), covering 52.16–60.21°N, 3.00–20.74°E. ~14 TB.
Catalog name dmi_10_minutes. Author: Thomas Bøvith (tbh@dmi.dk). Converter:
mlcast
IT-DPC — surface rainfall intensity over Italy
5-minute Surface Rainfall Intensity (SRI) from the Italian Department of Civil
Protection (DPC) network of 23 radars. Variable RR (kg m⁻² h⁻¹), 5-minute
steps, 2010 → end of 2025, grid 1200 × 1400 at 1 km, Transverse Mercator
(WGS 84), covering 35.06–47.57°N, 4.52–20.48°E. ~7 TB.
Catalog name it_dpc_sri_5min. Processed by Fondazione Bruno Kessler.
Converter:
mlcast
UK Met Office — C-band rain radar composite
5-minute precipitation rate from the UK Met Office C-band NIMROD radar network.
Variable RR (kg m⁻² h⁻¹, float32), 5-minute steps, 2005-07-05 → 2025-12-31
(2,055,276 timesteps, 100,404 missing), grid 1725 × 2175 at 1 km, OSGB 1936 /
British National Grid (EPSG:27700). ~31 TB. Identifier UK-METOFFICE-RADAR,
catalog name uk_metoffice_5min. Raw NIMROD from
CEDA,
converted via
mlcast
BE RMI RADCLIM — radar–rain-gauge merged precipitation over Belgium
Offline, reprocessed quantitative precipitation (QPE_MFB) from the Royal
Meteorological Institute of Belgium (RMI), merging four C-band radars (Jabbeke,
Wideumont, Helchteren, Avenois) with automatic rain-gauge networks via
mean-field bias correction. Variable rain_rate (kg m⁻² h⁻¹, float32,
standard name rainfall_flux), 5-minute steps, 2017-01-01 → 2023-11-30
(726,332 timesteps, 868 missing), grid 700 × 700 at 1 km, Belgian Lambert 2008
(EPSG:3812), covering 47.4–53.7°N, 0.3°W–9.7°E. Catalog name
be_rmi_radclim_mfb_5min. Contact: Maryna Lukach (rad_op@meteo.be). Converter:
mlcast
References:
Goudenhoofdt, E. & Delobbe, L. (2016). Generation and Verification of Rainfall Estimates from 10-Yr Volumetric Weather Radar Measurements. J. Hydrometeorol. 17(4), 1223–1242. Goudenhoofdt & Delobbe (2016)
Journée, M., Goudenhoofdt, E., Vannitsem, S. & Delobbe, L. (2023). Quantitative rainfall analysis of the 2021 mid-July flood event in Belgium. Hydrol. Earth Syst. Sci. 27(17), 3169–3189. Journée et al. (2023)
Format
Datasets are stored as GeoZarr (Zarr v2/v3 with proper georeferencing), following the MLCast Zarr format specification. In short:
CF-compliant coordinate and variable names
dimension ordering
time × H × W, one chunk per timestepdata variable in mm (depth), mm/h (rate), or dBZ (reflectivity)
NaN for missing / out-of-range data
mlcast_*global attributes recording provenance (version, identifier, creator)
The Validator enforces the full specification.
Per-provider converters
Several converter repositories exist under
github
| Repository | Description |
|---|---|
mlcast-dataset-DE-DWD-radklim | Conversion of radklim dataset to zarr |
mlcast-dataset-msgcpp | Code to convert msgcpp netCDF dataset to zarr |
mlcast-dataset-DMI-radar_precipitation | (no description) |
mlcast-dataset-IT-DPC-SRI | Code to convert the TIFF files from the Italian radar composite dataset to Zarr format. |
mlcast-dataset-tiff2zarr | Generic GeoTIFF → mlcast-compliant Zarr v3 converter |
mlcast-dataset-metoffice-nimrod | Download and convert UK Met Office NIMROD radar data to mlcast-compliant GeoTIFF |
mlcast-dataset-BE-RMI-radclim | This project contains the needed source code to create a mlcast-dataset zarr archive of the Belgian RMI RADCLIM dataset |
Sampling training-ready data
mlcast(t, x, y) indices that point directly
into the source data — ready for a PyTorch Dataset. It runs in two steps.
Run directly with uvx (no installation needed):
uvx --from "git+https://github.com/mlcast-community/mlcast-dataset-sampler" mlcast.sample_dataset --helpStep 1 — Filter valid datacubes
Scan the dataset and identify valid datacube coordinates (handles time gaps and NaN regions):
uv run mlcast.sample_dataset filter-nan /path/to/radar.zarr \
    --start-date 2021-01-01 \
    --end-date 2024-12-31 \
    --time-depth 24 \
    --width 256 \
    --height 256 \
    --max-nan 10000
This outputs a CSV of valid (t, x, y) coordinates.
Step 2 — Importance sampling
Weight samples by rain intensity:
uv run mlcast.sample_dataset sample /path/to/radar.zarr \
    valid_datacubes_2021-01-01-2024-12-31_24x256x256_3x16x16_10000.csv \
    --q-min 1e-4 \
    --mean-weight 0.1
Why importance sampling? Equal-frequency sampling gives every precipitation
intensity the same probability, which causes models to hallucinate thunderstorms
after ~30 minutes of lead time. Importance sampling sets a minimum selection
probability (--q-min) for all samples and adds a weighted contribution based on
mean rain rate (--mean-weight), keeping low-intensity samples in training while
oversampling interesting meteorological events.
Contributing a dataset
The community is always looking for new datasets. To contribute, open an issue or pull request on mlcast-datasets, and check your Zarr archive against the spec with the Validator first.
- Goudenhoofdt, E., & Delobbe, L. (2016). Generation and Verification of Rainfall Estimates from 10-Yr Volumetric Weather Radar Measurements. Journal of Hydrometeorology, 17(4), 1223–1242. 10.1175/jhm-d-15-0166.1
- Journée, M., Goudenhoofdt, E., Vannitsem, S., & Delobbe, L. (2023). Quantitative rainfall analysis of the 2021 mid-July flood event in Belgium. Hydrology and Earth System Sciences, 27(17), 3169–3189. 10.5194/hess-27-3169-2023