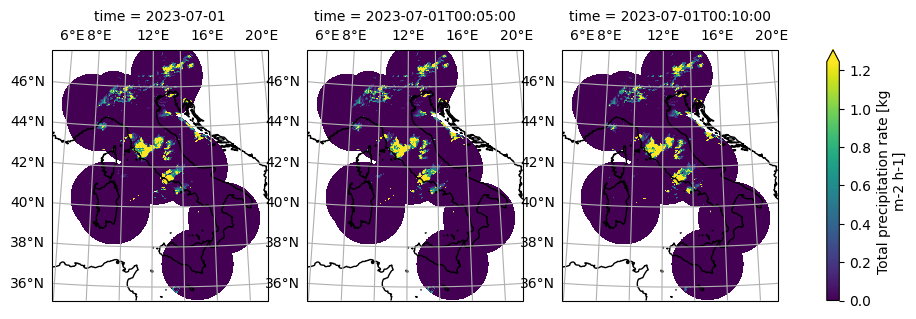
This notebook describes how to access and use the zarr-version of the Italian DPC SRI dataset. The dataset includes 5-minute Surface Rainfall Intensity (SRI) measurements in mm/h at 1 km x 1 km spatial resolution over Italy, derived from the national radar network (23 radars) operated by the Italian Department of Civil Protection (Dipartimento Protezione Civile). The v0.1.0 zarr version of the dataset covers 2010 to the end of 2025.
The conversion of the radar data was done by the code hosted on https://
import matplotlib.pyplot as plt
import cartopy.crs as ccrs

import mlcast_datasets
cat = mlcast_datasets.open_catalog()
list(cat.precipitation)['radklim_hourly',
'radklim_5_minutes',
'dmi_10_minutes',
'it_dpc_sri_5min',
'uk_metoffice_5min',
'be_rmi_radclim_mfb_5min']
IT-DPC 5-min Surface Rainfall Intensity
The Italian DPC SRI dataset is available in the intake catalog as it_dpc_sri_5min.
ds = cat.precipitation.it_dpc_sri_5min.to_dask()
ds
Loading...
var_name = "RR"

crs_name = ds[var_name].grid_mapping
data_crs = ccrs.Projection(ds[crs_name].crs_wkt)

g = (
    ds[var_name]
    .sel(time="2023-07-01")
    .isel(time=slice(None, 3))
    .plot(
        transform=data_crs,
        cmap="viridis",
        add_colorbar=True,
        col="time",
        robust=True,
        subplot_kws=dict(projection=data_crs),
        vmin=0,
    )
)

for ax in g.axes.flat:
    ax.coastlines()
    ax.gridlines(draw_labels=["top", "left"])
/tmp/ipykernel_2649/891365573.py:21: FutureWarning: self.axes is deprecated since 2022.11 in order to align with matplotlibs plt.subplots, use self.axs instead.
for ax in g.axes.flat: